TelXL Reporting
TelXL provides two types of reporting:
Live reporting at TelXL Portal | Documentation of live reports
Historical reporting - Microsoft Power BI
 Download our latest Power BI template.
This set of pages focuses on historical reporting which is the ability to look at data from the system going back a set maximum amount of time. This data retention period is 18 months by default but can be customized from the Cxp portal.
Historical reporting
In historical reporting for Cxp we strive to show from high-level to low-level data about the various entities and features that make up Cxp such as bots, queues, agents, work items, conversations (calls, emails, chats).
The data is usually available in historical reporting within a few minutes of the event occurring in the system. Nevertheless, in order to avoid overexertion of historical reporting resources and for the purposes of monitoring data from the current day, we suggest using the Cxp Portal's live reports and Power BI to analyze data from at least the previous day.
What is Power BI
Historical reports for Cxp are created using Microsoft Power BI. Power BI is an interactive data visualization software product developed by Microsoft with a primary focus on business intelligence. The reports can be viewed either through the web at Power BI Service or in the desktop application Power BI Desktop by opening a file with the '.pbit' extension provided by TelXL.
Data can be imported from various sources including Odata feed that Cxp uses.
The data can be viewed, edited, and published using Power BI Desktop application (free tool).
Publishing the report to the Power BI Online Service has many advantages, such as easily sharing the report with colleagues, embedding the report in Microsoft Teams, setting up subscriptions, creation of dashboards.
Power BI online service requires Power BI Professional or Premium license.
Accessing the Power BI Reports
In order to consume TelXL's Odata feed through Power BI and see/construct reports from it, you will first have to fulfill these requirements:
Have a valid Microsoft Organizational account.
Have this account registered in at least one TelXL customer tenant. This is done by TelXL on request. The account can be activated with the link provided in the confirmation email you get as a result.
Enable the
Power BI accessoption on the user associated with the account. For more on this, click here.Your TelXL channels (and by extension workflows, queue treatments, announcements and campaigns) all need to have been configured on what we often refer to as the new TelXL portal.
A system administrator of your Azure Active Directory must access the following link to consent on behalf of your organization that you may authenticate yourself to TelXL by use of your MS account. (There is no need to replace any part of this link, the client_id parameter is the TelXL application's ID) https://login.microsoftonline.com/common/adminconsent?client_id=0f0d8e91-10ab-4f2c-ae88-9c89aefc9b4a
Note
The last point of the prerequisites above is required only upon first-time accessing of the Odata feed by your tenant.
It is the manual triggering of the same kind of consent flow as what is automatically triggered during first login to TelXL by way of a Microsoft Organizational account. Manual triggering is necessary as Power BI Desktop does not have the ability to do it automatically, instead it sends this error message
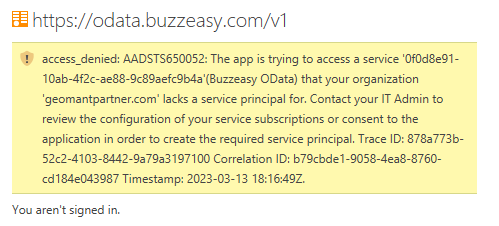
Note
The administrator consent is required so that TelXL will be allowed to view only your basic profile information (name, picture, user name). For access to its Odata feed TelXL does not require any additional permissions beyond the absolute basic profile information which is the minimal that Microsoft will allow. This is needed so that TelXL will be able to identify the user as one of the MS organizational accounts registered in TelXL.
Before consent is actually granted the Microsoft form will list the one permission requested with the option to either Accept or Cancel.
For more information on the consent experience, please see the Microsoft article on understanding Azure AD application consent experiences.
The report (.pbix) or the report template (.pbit) files can be opened using Power BI Desktop application.\
- .pbit - file extension includes the structure only (no data)
- .pbix - file extension includes the data last refreshed.
The data source is at the endpoint: https://odata.telxl.net/v1/
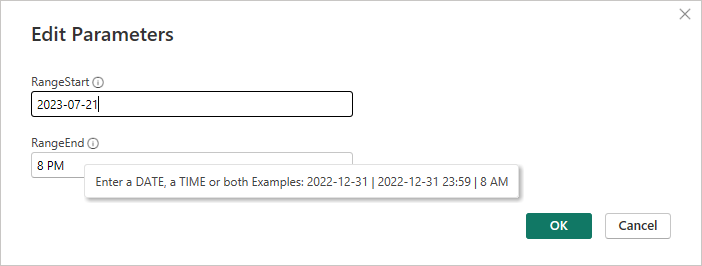
If you have a .pbit file, you may be asked to provide some parameters before data is loaded into Power BI. See the tooltips next to each parameter to help you enter a correct format.
Cxp uses Organizational authentication so you can use your Azure Active Directory (AAD) credentials to access the reports from Power BI Desktop app.
The account needs to have a user entity in Cxp.
To change the data source URL or your credentials, click the downward arrow of the 'Transform data' button, then 'Data source settings'
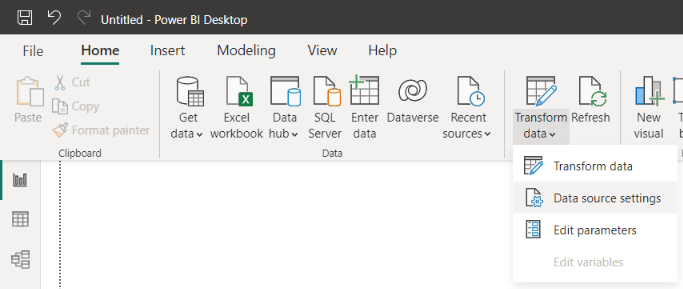
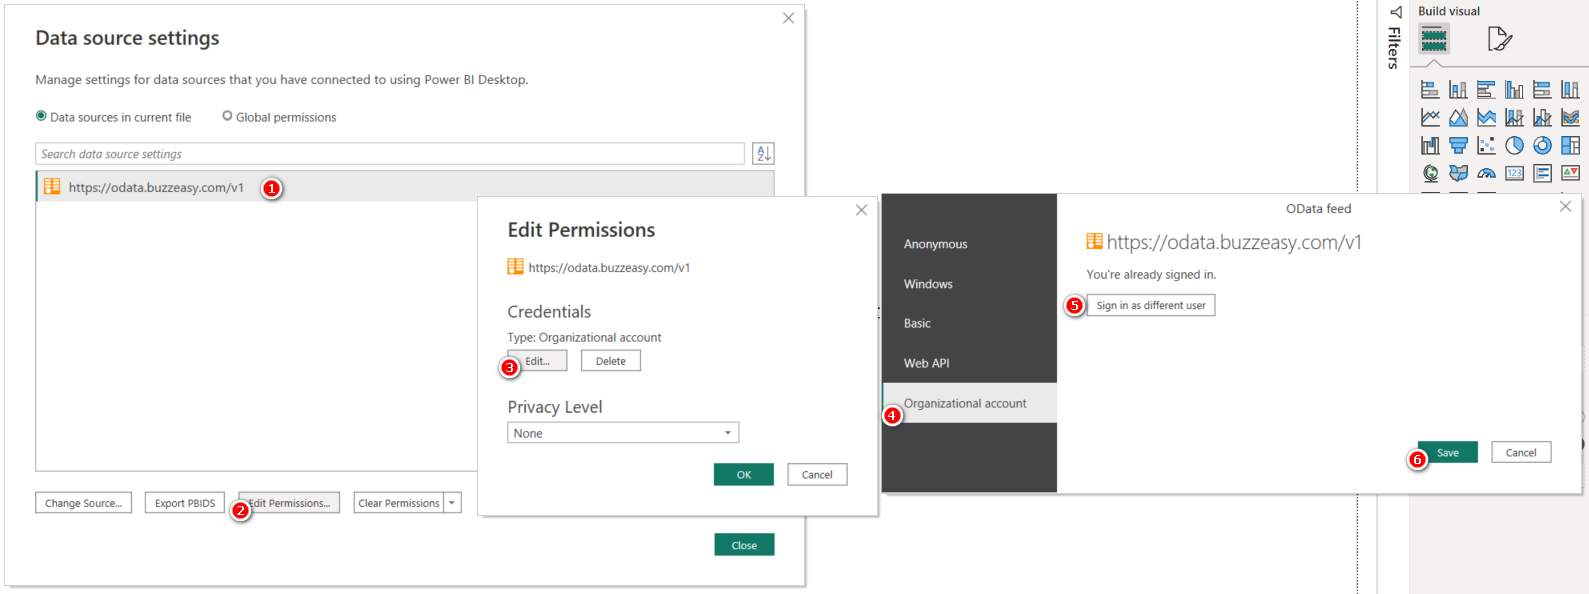
Power BI Odata feed address and data connection
Refreshing the report in Power BI
There are different ways to refresh the reporting dataset depending on where you're viewing the report from:
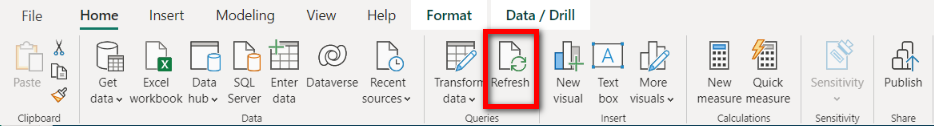
- Refreshing the report in Power BI desktop application by clicking on the refresh button in the menu ribbon.
- Refreshing manually once the report is published to the Power BI service.

- Setup scheduled refresh for the reports published to the Power BI service.
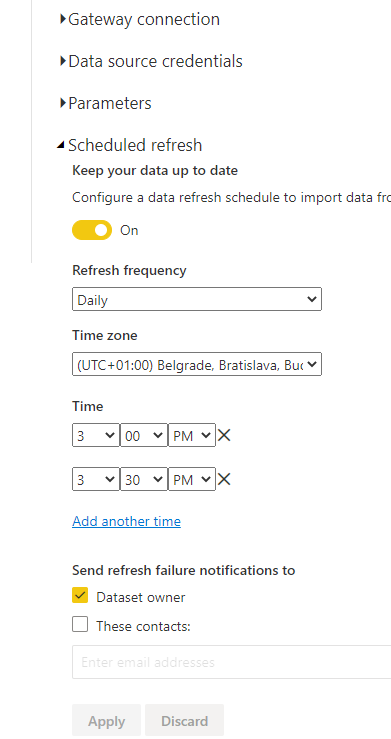
Note
Scheduled refreshes are limited to 8 times a day with Power BI professional licenses.
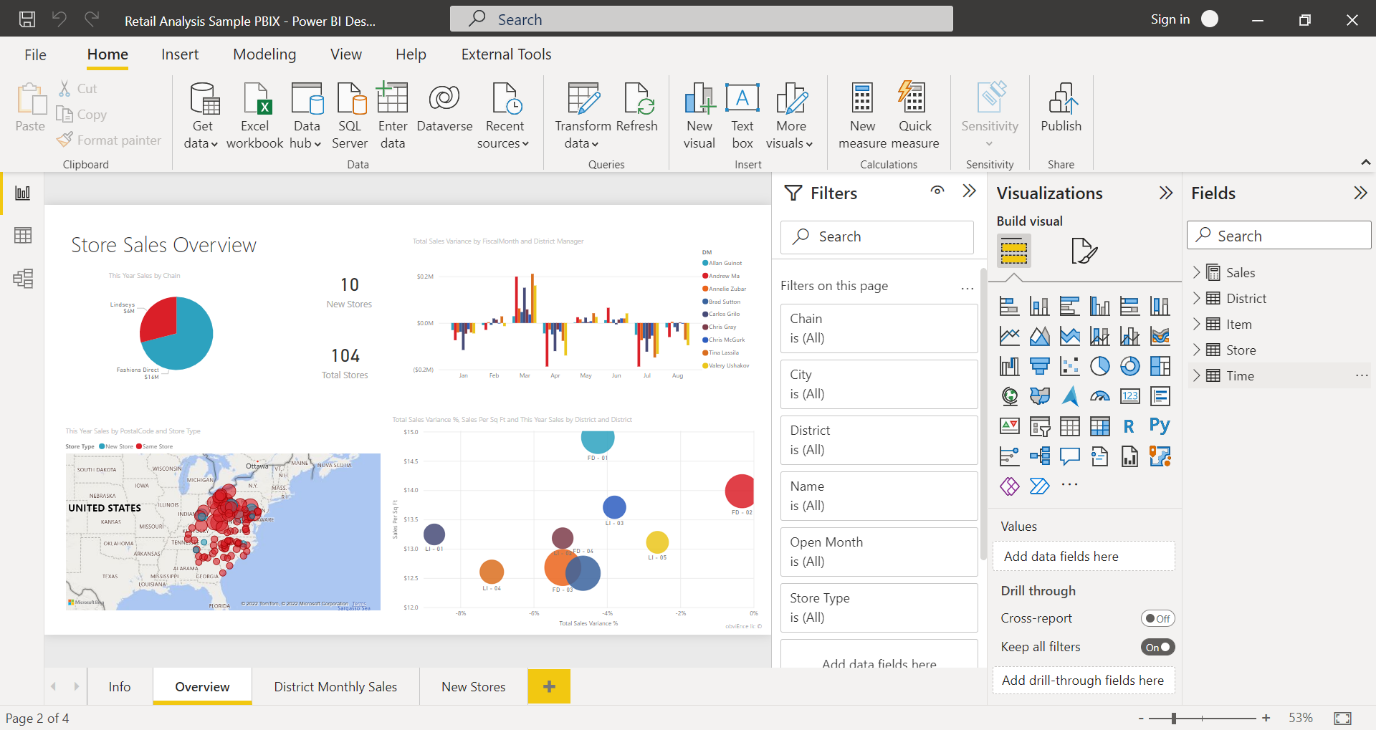
Different views in Power BI Desktop
In Power BI desktop we differentiate three types of views:
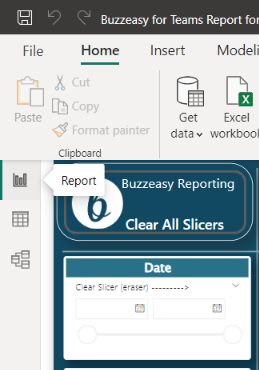
Report view - Displays the data and all visuals
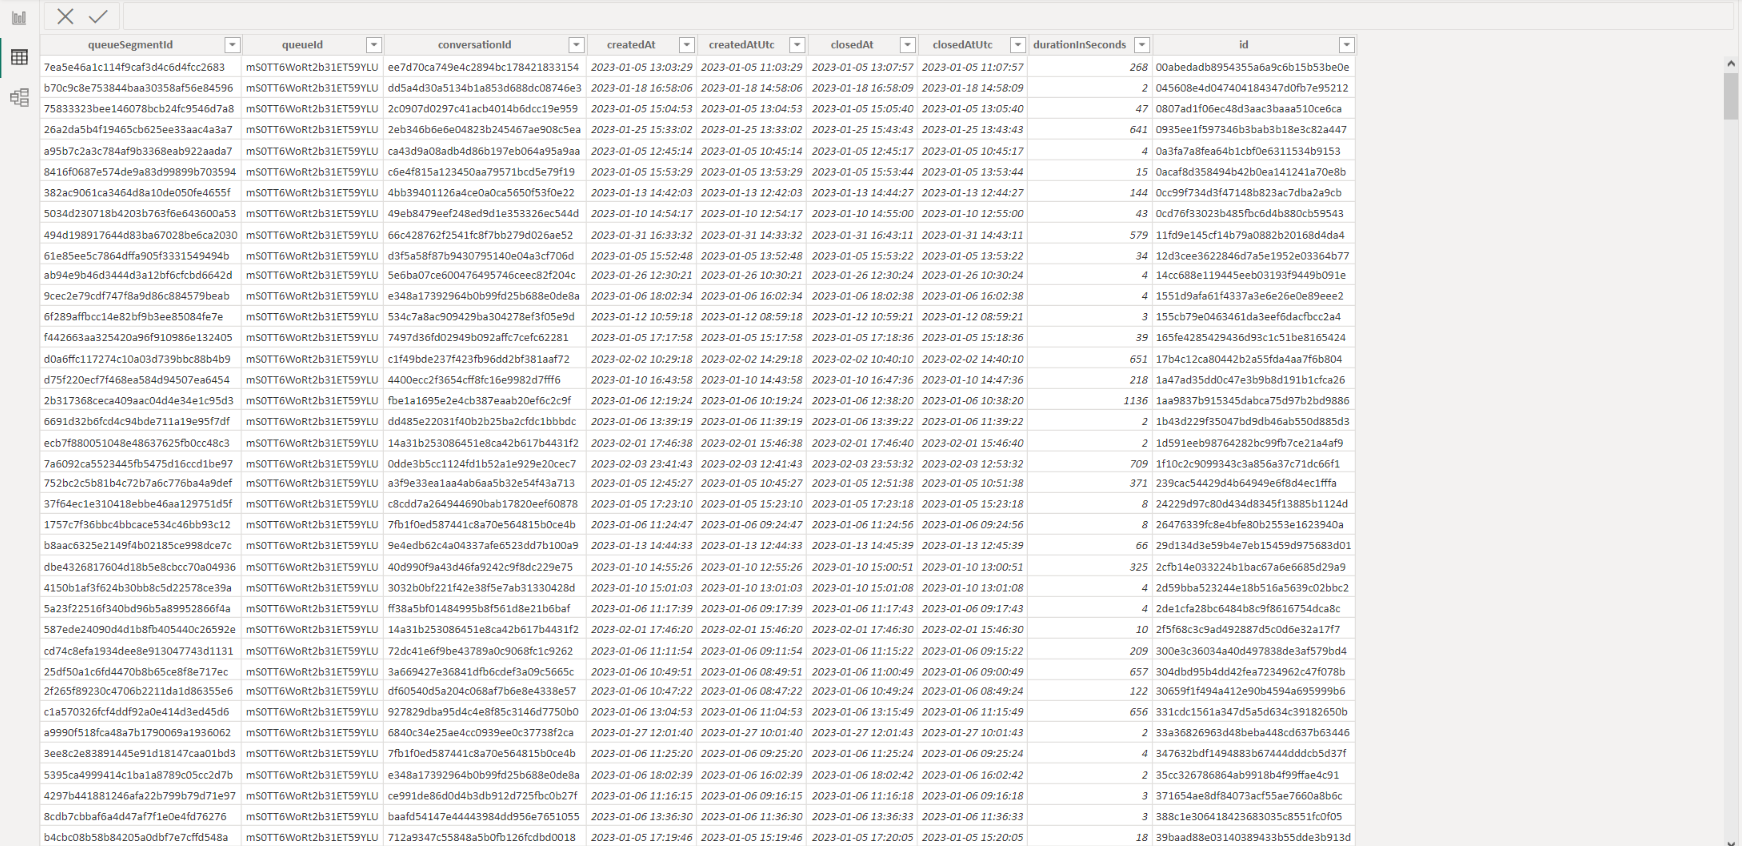
Data view - Shows the raw data
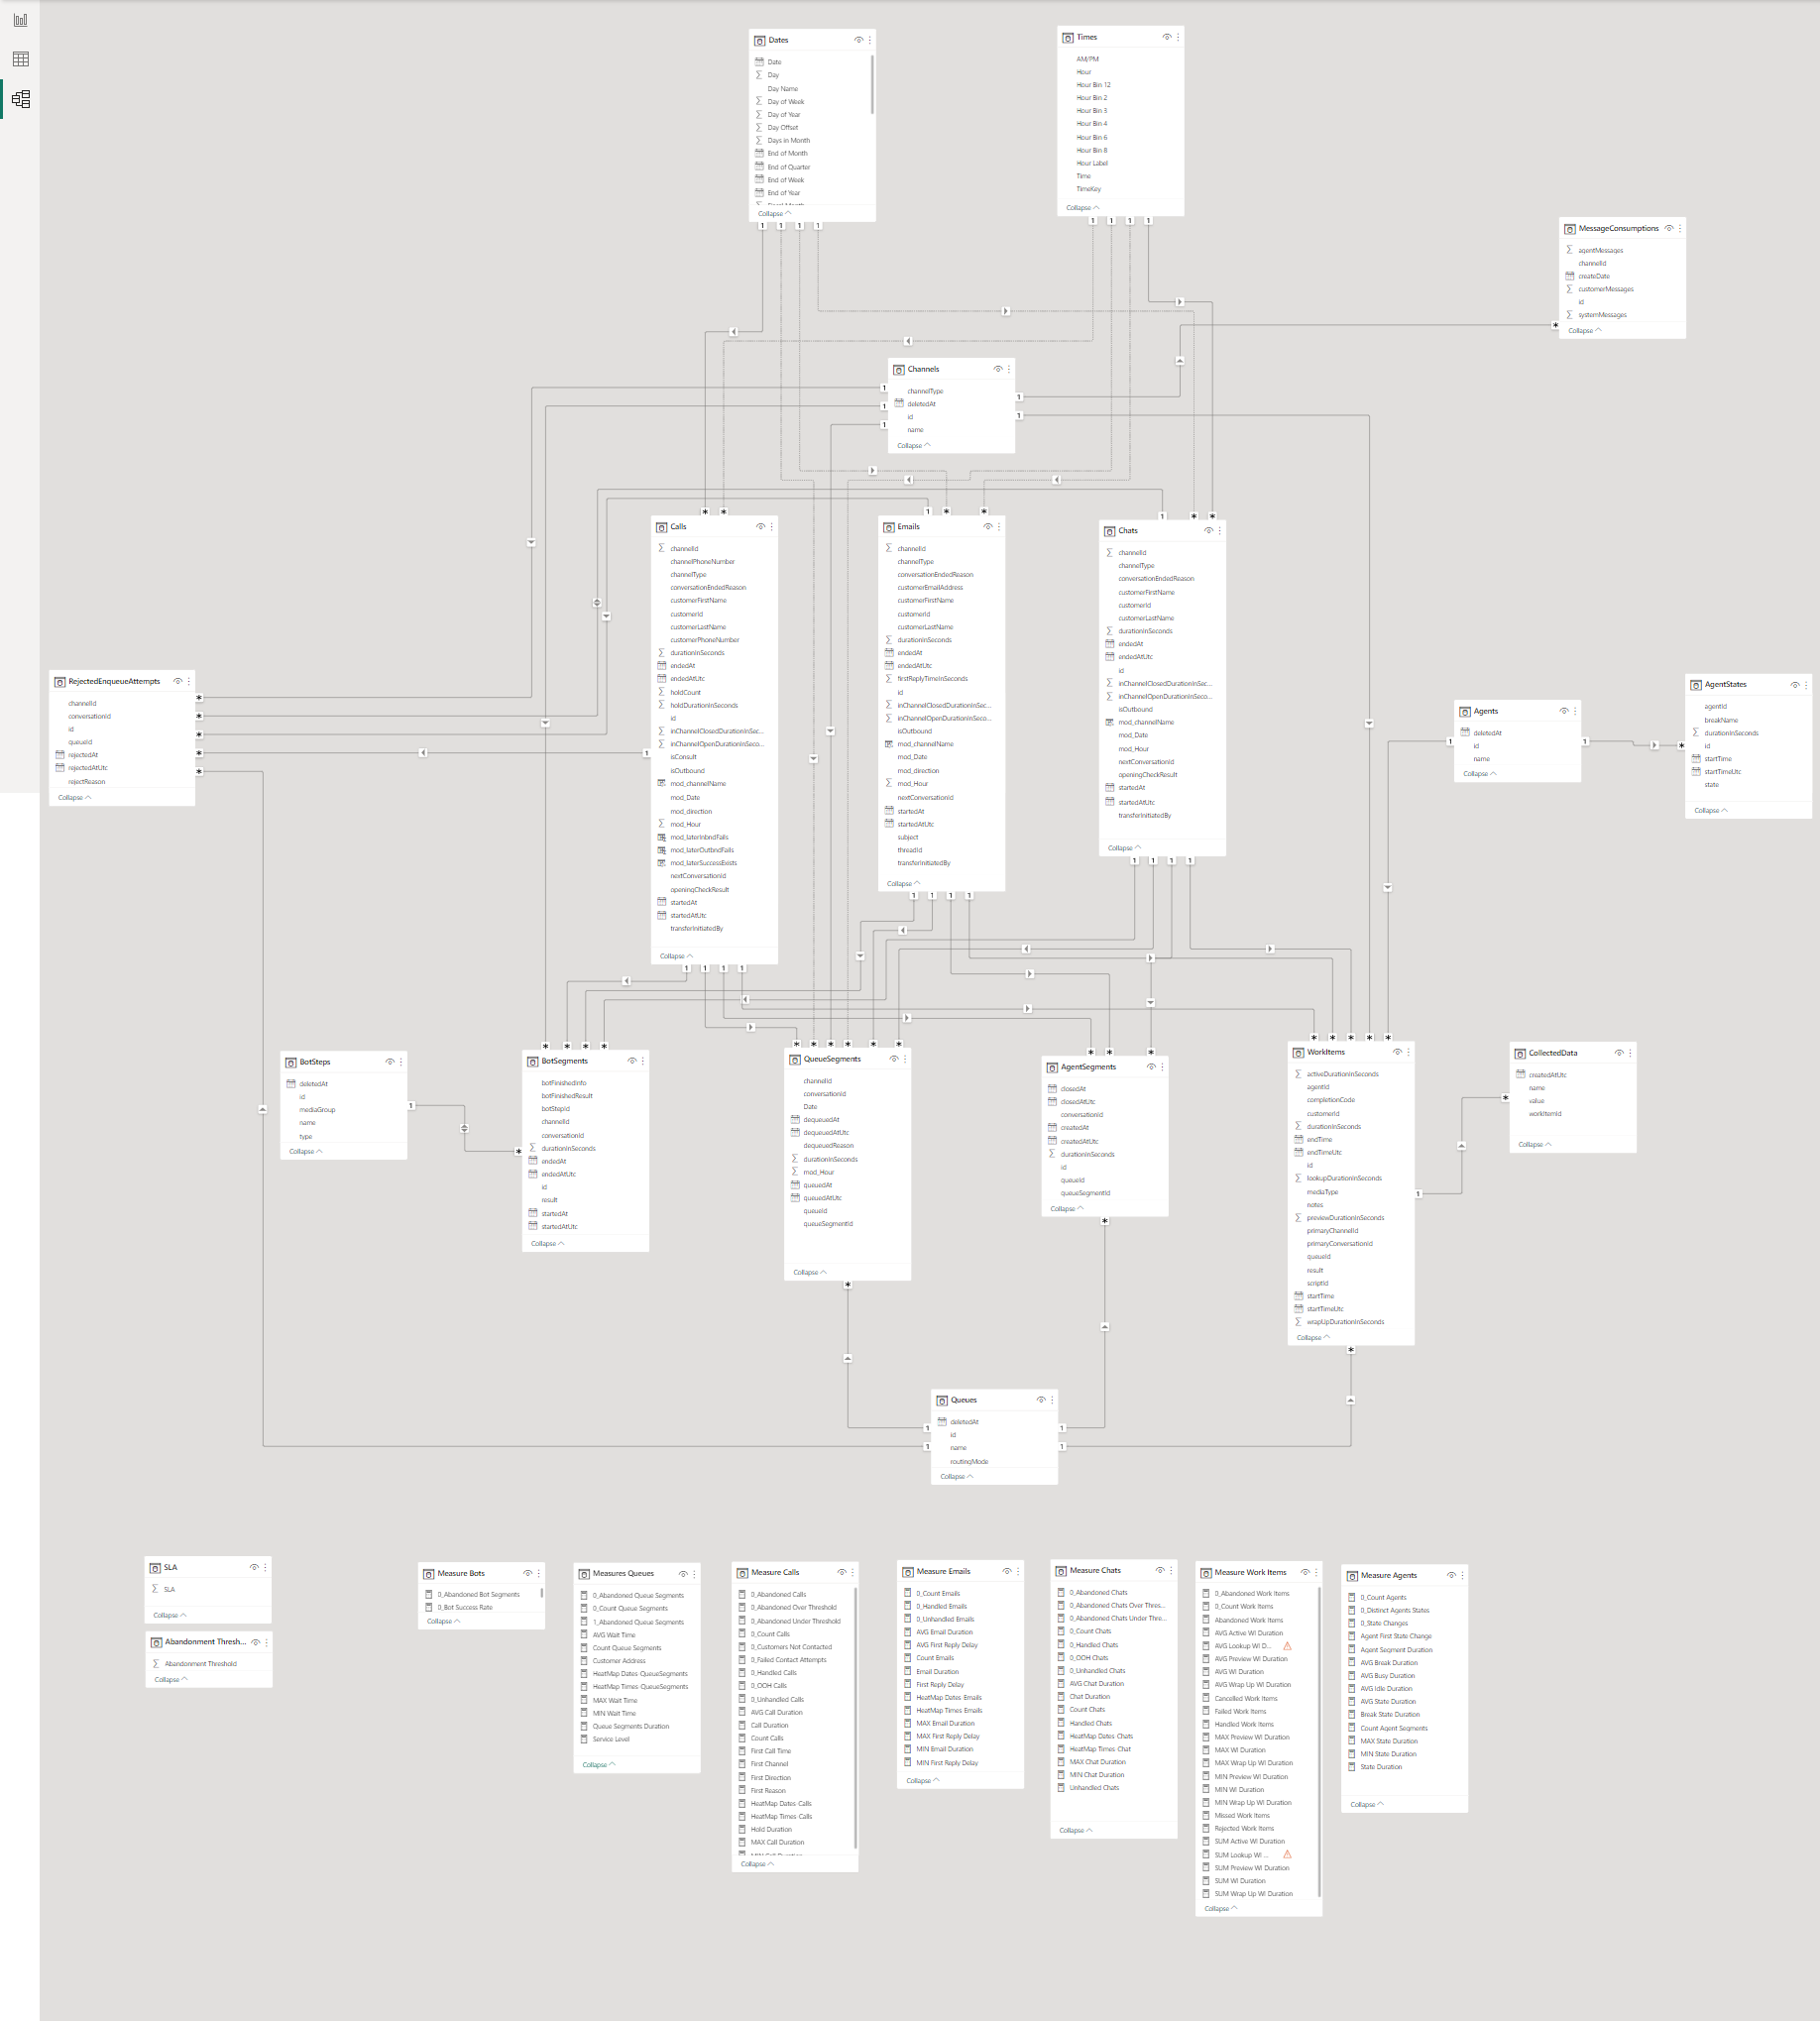
Model view - Shows the relationship between tables
Warning
To see the actual tables and relationships used in your report (which might be slighly different from the screenshot below due to its evolution), please see the model view in your Power BI file or open the following URL for the metadata definition file: https://odata.telxl.net/v1/$metadata
Programatic access to the Odata feed
If you wish to access TelXL reporting data from your own application, this has to be signaled to TelXL as it is not part of the usual onboarding process.
Upon receiving this request, we will
- create a new API client for this specific purpose and associate it to your TelXL tenant
- provide the two parameters you will need to get an access token with which to use the API:
- client_id
- client_secret
Getting an access token
Once you have your client_id and client_secret, you can use these to get an API access token by sending a POST request to the URL provided to you by TelXL.
Sample request
curl -X POST -H "Content-Type: application/x-www-form-urlencoded" -d
"client_id=<yourClientId>&client_secret=<yourClientSecret>&scope=odata&grant_type=client_credentials"
<URL>
Sample response
{"access_token":"<yourAccessToken>","expires_in":3600,"token_type":"Bearer","scope":"odata"}
Calling TelXL Odata endpoints
Once you have your access token, include it in each API request's header when calling TelXL Odata endpoints with the request header\
- Authorization: Bearer <your_token>
- Endpoint: odata.telxl.net
Historical report pages
General
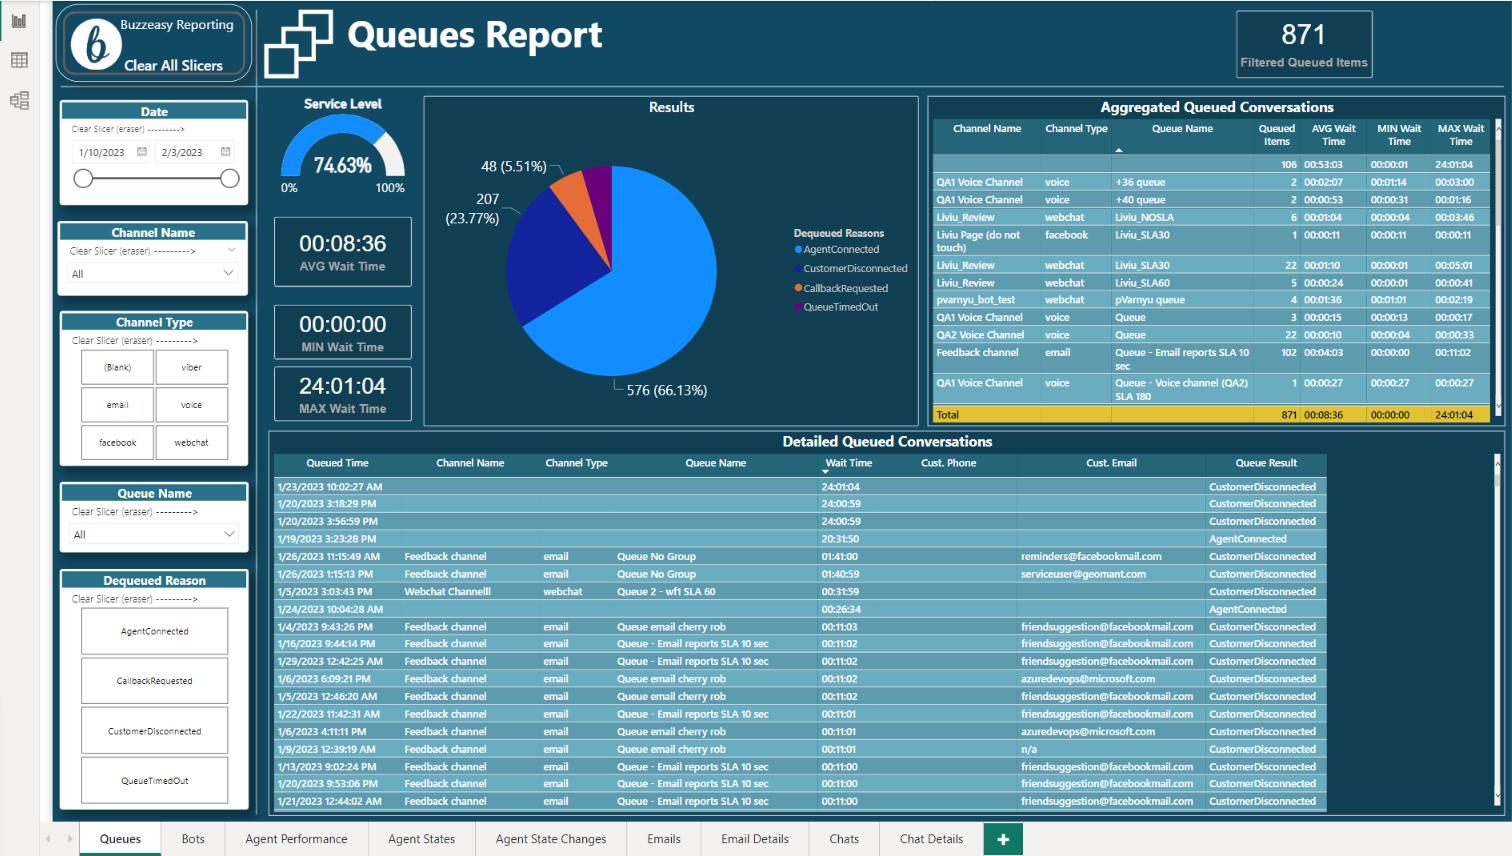
Data visualizations and tables are organized across a number of pages. Each page aims to display information relevant to a particular area of the report such as agents, calls, emails etc.
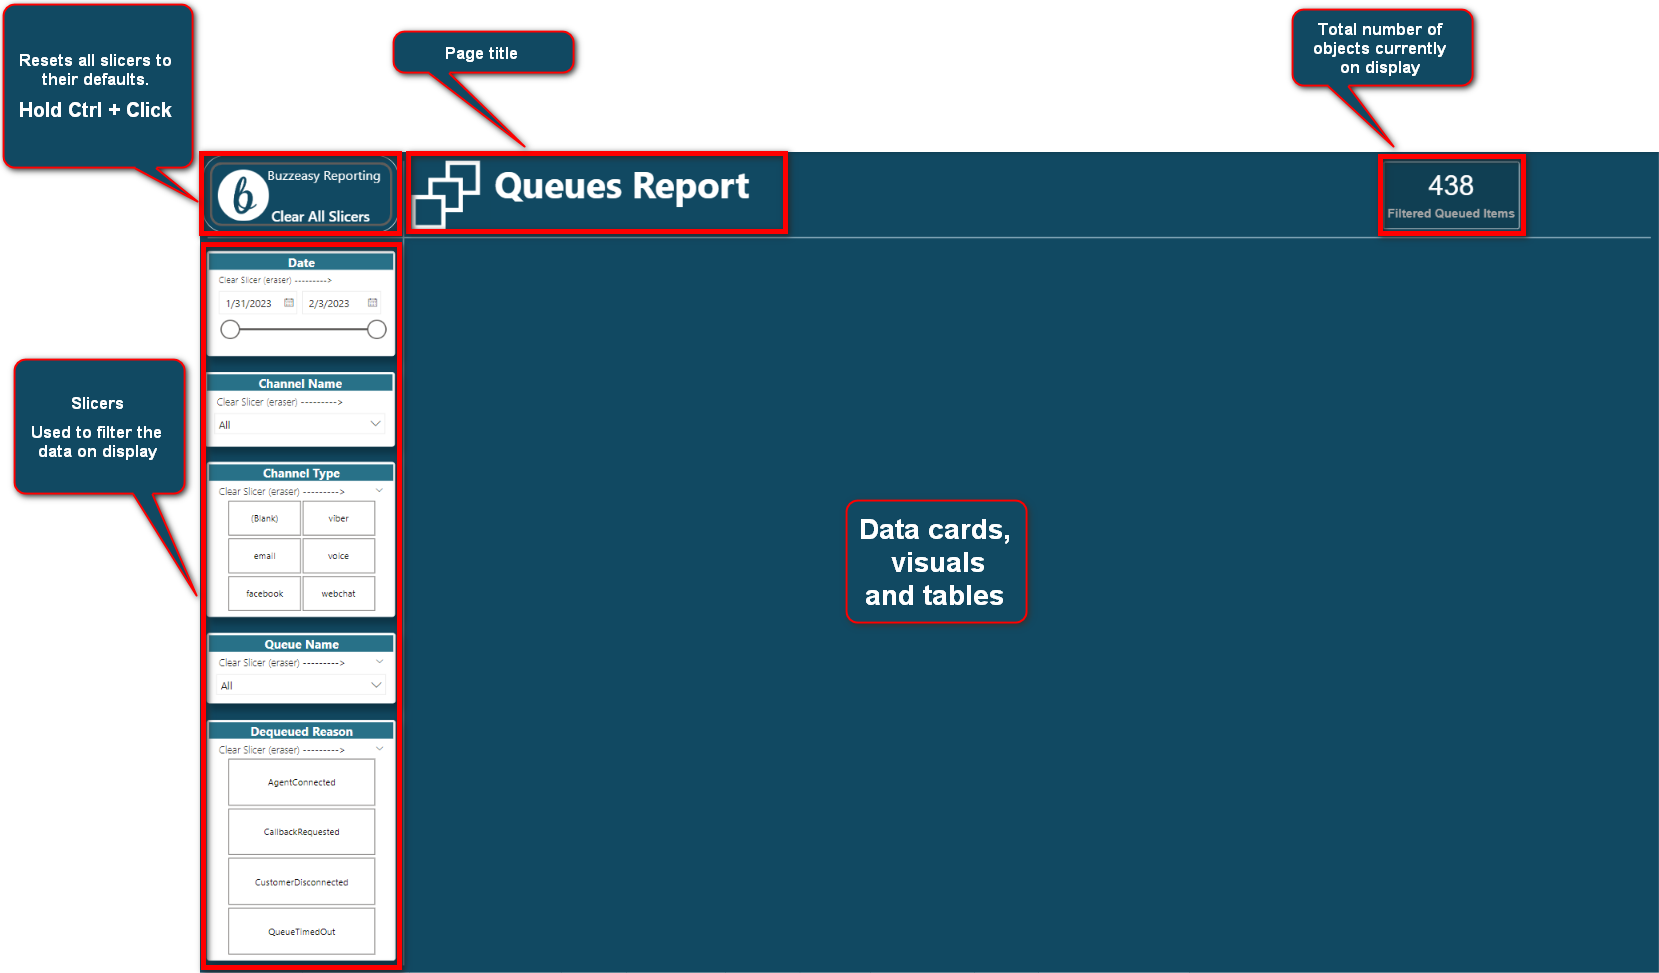
In general, the layout of a page is as follows:
- Slicers reset button
- Page title
- Object counter card
- Slicers
- Display area (data cards, visuals, tables)
Tip
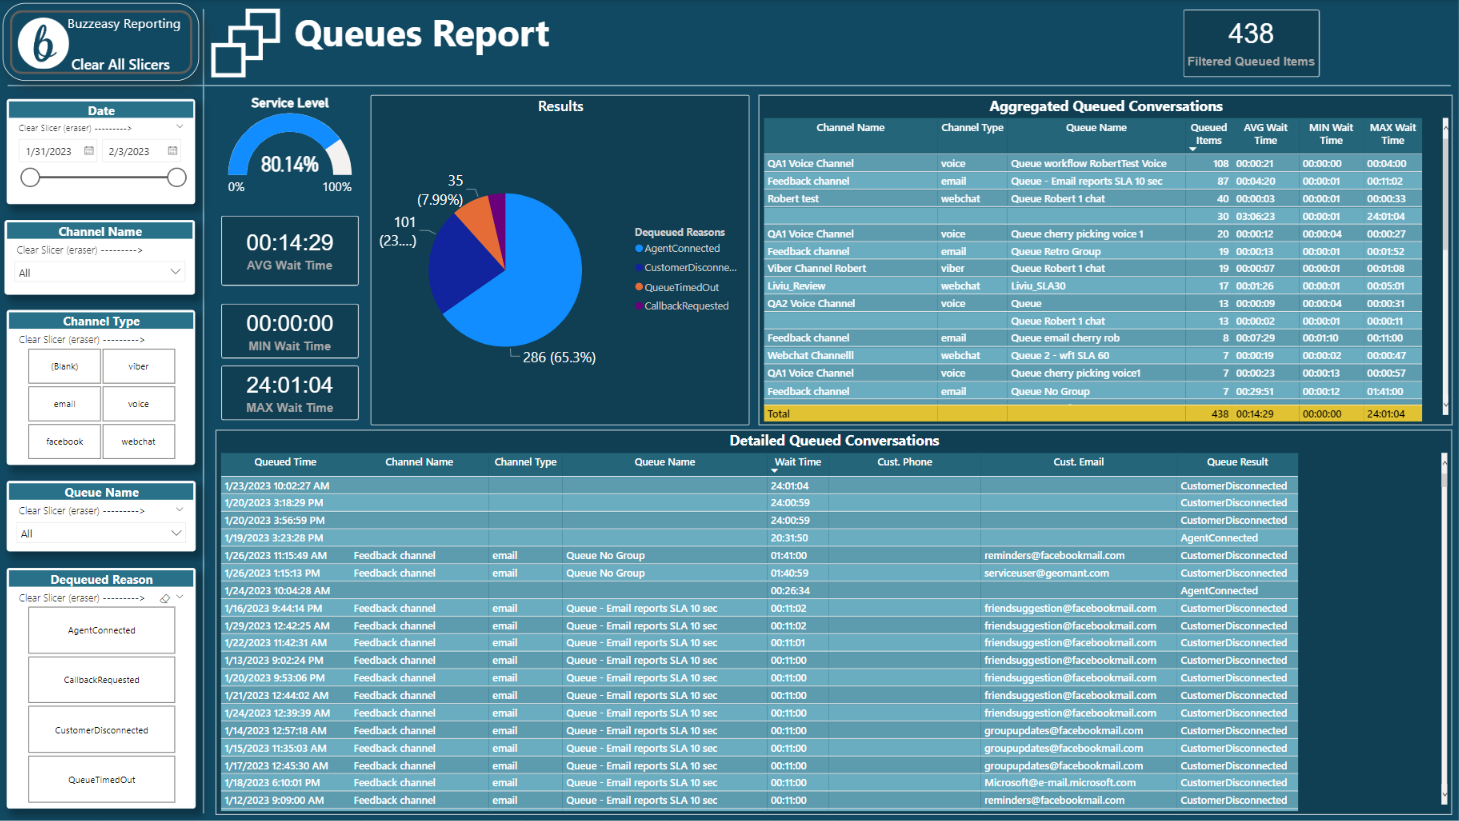
Filtering the contents of a page can be done with the help of the slicers but also -- in some cases -- by selecting a particular part of a visual, including table rows. You can use these in combination of the standard slicers to fine-tune the data you want to see.
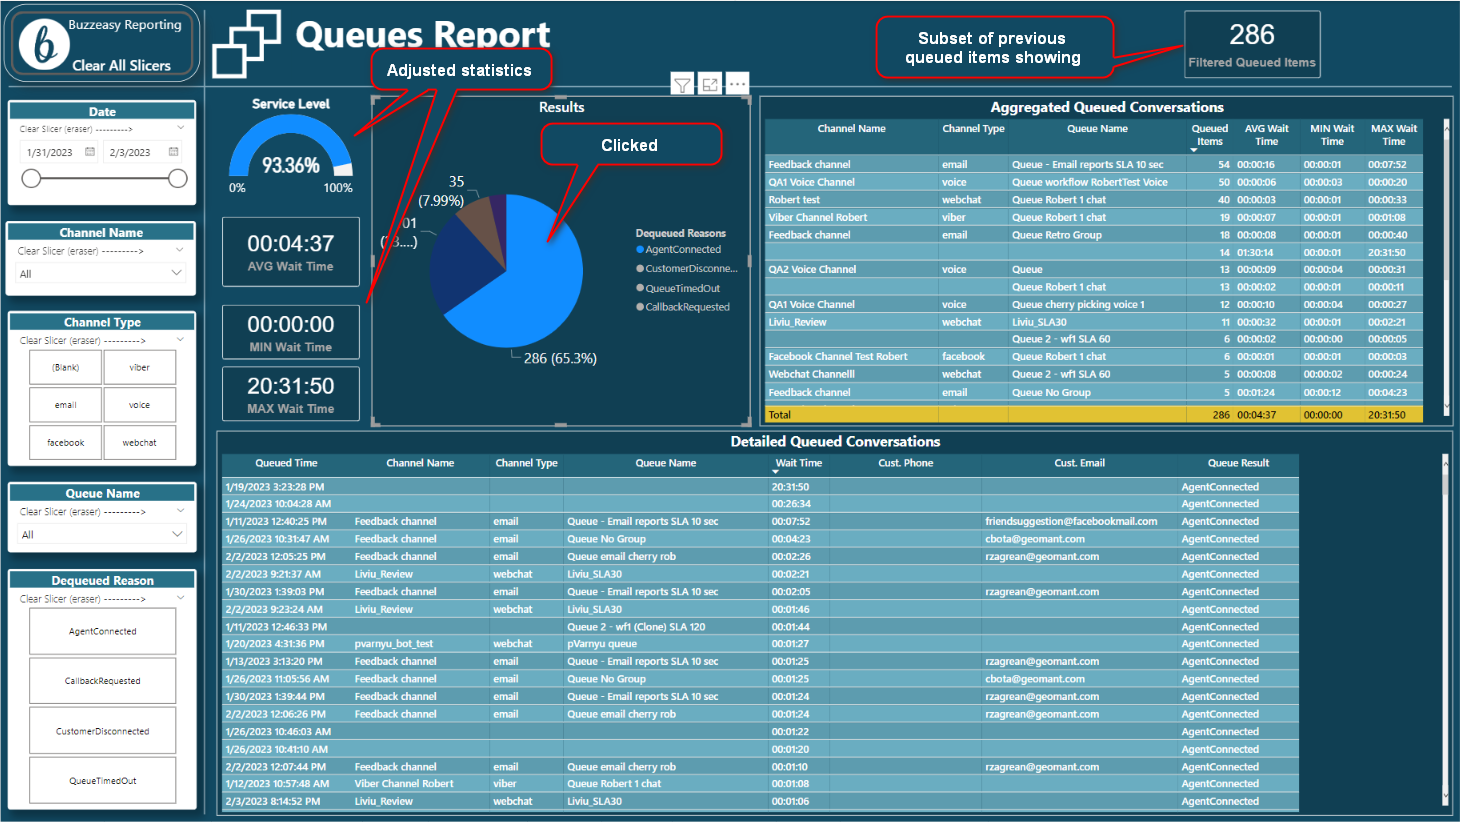
E.g. click on the AgentConnected slice of the pie chart to highlight that slice of the chart and to show only queued items with this result in other visuals on the same page.
BEFORE
AFTER
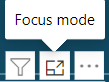
Tip
To view any visual on the full page, hover over the visual, wait for the three option buttons to appear, then click 'Focus mode'
Tip
For a complete list of possible values and their meanings such as 'QueueTimedOut' as a dequeued reason, visit the Technical section of the online doumentation.
Glossary
A glossary of the technical terms used in this and other TelXL related documents can be found here.